Fusiomica drug discovery
Our lead binder targets a marker shared by several cancers
We’re developing our own binder for cancer imaging and treatment. We use AI to shorten design rounds. Then we plan a small PET study to see whether the binder reaches tumours in people.
What is theranostics?
Theranostics pairs a scan with a treatment that targets the same marker. A PET tracer shows which tumours take it up and can help doctors select patients for treatment. A therapeutic radioligand binds the same marker and delivers radiation nearby.
- PET scan
- Same tumour marker
- Targeted radiation
We plan to use our lead binder first as a PET tracer. If it reaches tumours in people, we can assess a version that carries a therapeutic isotope.
Lab evidence
What we’ve seen in the lab
To refine the lead, we compare the activity of successive designs. We use microscopy to check where the labelled binder stains cancer cells.
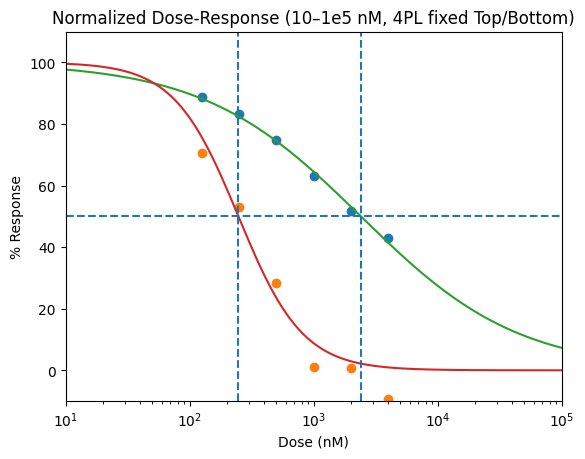
Activity after optimisation
The second-generation binder reaches a comparable response at a lower concentration.
Patent applications filed for the programme.
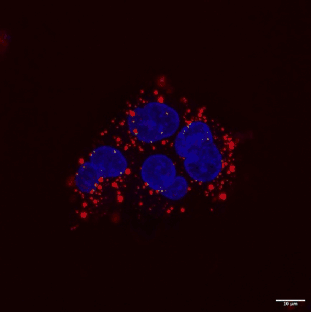
Fluorescence microscopy
Fluorescent binder staining in PANC-1 cells. The binder signal is red and nuclei are blue.
Development plan
From lead optimisation to the first PET study
The next study will track the labelled binder in animals. We’ll use the uptake data to prepare the PET tracer for a first study in people.
Development roadmap
Target selection
Complete
Hit identification
Complete
Hit to lead
Complete
Lead optimisation
Just started
Preclinical studies
In vivo tests start in Q1 2027
Phase 0
Planned
What we plan to measure in Phase 0
Once the safety work and approvals are in place, we plan to give a microdose of labelled binder in a supervised PET study. The scan will show how much reaches tumours, where else it goes and how long it stays. A microdose limits exposure and can reduce the preclinical work needed for the first study. The results will help us decide whether to develop a version that delivers therapeutic radiation. Later trials assess treatment benefit.
FDA guidance on microdose radiopharmaceuticalsTime from target idea to first human data
Conventional ADC path
First-in-human therapeutic study
US$8–11m reported contract range
Fusiomica imaging-first plan
Phase 0 PET uptake data
About €1.2m planned through Phase 0
Planning comparison. The ADC timeline is an illustrative benchmark. The Phase 0 range is our estimate from discovery. The studies answer different questions, and the budgets cover different work.
Why we want human data earlier
Faster design gives us more candidates to work with. A small exploratory study can help us decide which targets are worth taking into larger trials.
Eroom’s law
Index, 1950 = 100. Illustrative trend based on a halving every nine years.
Historically, the number of drug approvals per billion dollars of R&D spending fell by about half every nine years, after adjusting for inflation. We want to shorten the time between designing a binder and learning where it goes in people.
Scannell et al. on Eroom’s law · What will it take for AI to change drug discovery?Too many programmes chase the same targets
- PD-1 / PD-L1 · cancer300+
- GLP-1 · obesity200+
- CD19150+
- KRAS150+
Many programmes pursue the same targets. A small Phase 0 PET study can test whether a binder reaches tumours in people and where else it accumulates. Those data reduce uncertainty about delivery before we commit to a larger trial. That makes it easier to assess targets that established drug developers may consider too risky.
Bruce Booth on pipeline crowding · LifeSciVCDelivery and imaging for ADCs and radioligands
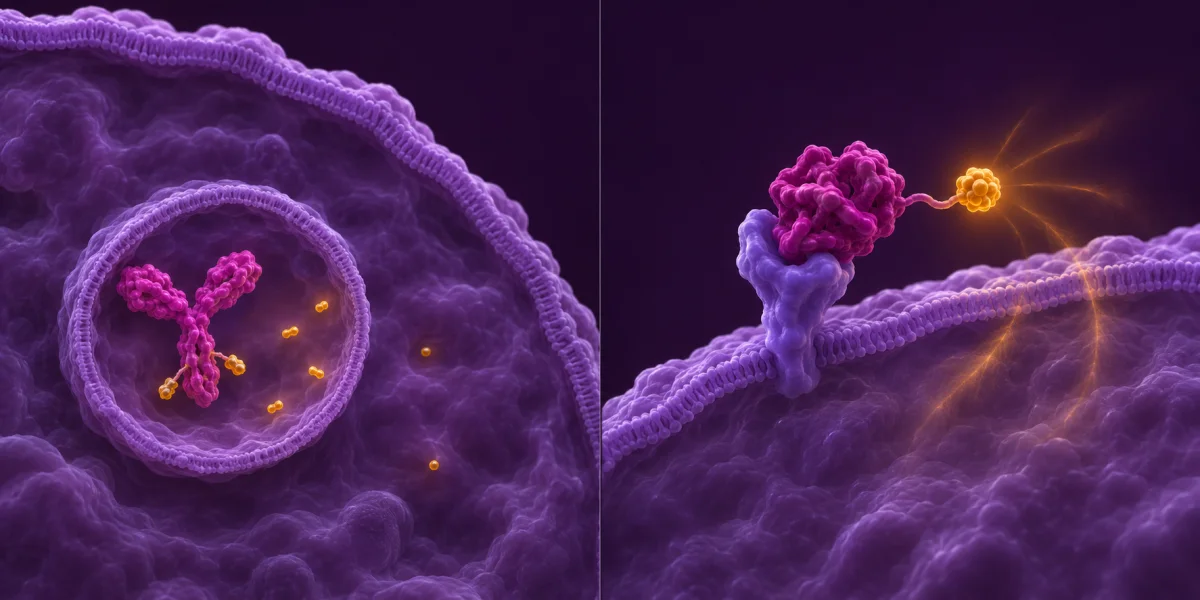
ADC · Releases a drug
Many ADCs enter the cell and release a drug payload after the linker breaks.
A standard ADC gives no signal on PET. Imaging where it accumulates takes a separate radiolabelling study.
RLT · Delivers radiation
A binder carries a radionuclide to the target. Its decay deposits energy in nearby tissue.
A paired PET tracer shows where the binder accumulates in tumours and healthy organs. Repeat scans can track how long it stays.
A radionuclide decays at a known rate. By measuring uptake and retention, we can estimate the radiation dose to tumours and healthy organs. Treatment response is a separate clinical question.
EANM guidance on dosimetry · FDA guidance on ADCs